Connect your database
Enter your hospital database details on screen. Prism tests the connection, reads the schema and flags anything your installation has customised. No developer, no site visit.
Read-only. It cannot write to your system.
Every admission, bill, receipt and stock movement is already recorded. What management lacks is a way to look at it while there is still time to act. Prism is that way.
Works with any hospital system — and with none. If you cannot open your database, upload a spreadsheet instead.
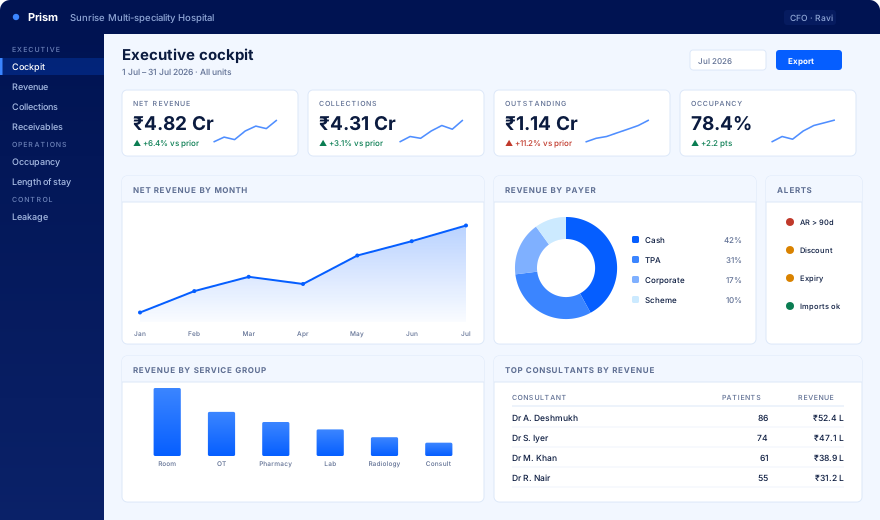
Prism is hospital management intelligence software. It reads data from your existing hospital information system, or from spreadsheets you upload, and turns it into dashboards covering revenue, collections, receivables, occupancy, length of stay, pharmacy, inventory and leakage control. Every figure drills down to the individual transaction.
By the time the month-end MIS reaches the management meeting, the month it describes is already over. Nobody can act on it. They can only explain it.
Why did collections fall this week?
Which consultant discounts the most?
How much is stuck with which TPA?
Which beds earn, and which ones sit?
Is this month better than last?
None of these need new data. Only a way to look.
Billing, finance and the ward each keep their own sheet, and the meeting argues about whose figure is right instead of what to do.
The MIS executive who builds the Excel becomes a single point of failure — and a bottleneck for every new question.
“Show me discount by consultant by ward” means another request, another sheet, another week.
Whether a hospital has a live network link or emails a spreadsheet once a month, the figures come out identical — every route runs the same rules into the same tables.
Enter your hospital database details on screen. Prism tests the connection, reads the schema and flags anything your installation has customised. No developer, no site visit.
Read-only. It cannot write to your system.
No network route, a branch that emails an extract, or a one-time history load. Prism validates the file up front and tells you what is missing rather than half-loading it.
You do not need to be a Caresoft customer.
Expenses and other income line up against hospital revenue, so you get a departmental P&L instead of a revenue report and an accounting report sitting side by side.
Refreshed on the same schedule as everything else.
Every number on every dashboard is a doorway. Nobody has to request a second report to find out why.
Net revenue is down 4.2% this month.
The fall is entirely in OT charges.
Two surgeons account for most of the gap.
17 procedures billed below the rate master.
The question that used to take a week takes ninety seconds — and the answer is the same number the board was looking at, not a different extract.
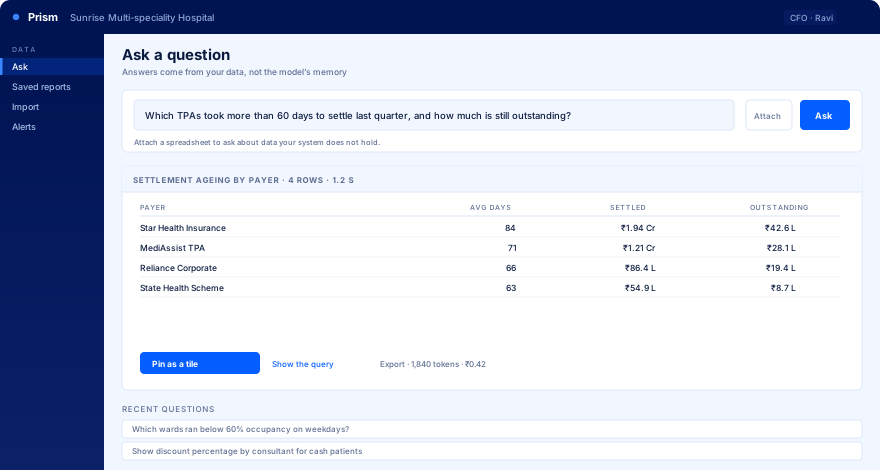
No hospital's requirement list ever stays fixed. Instead of raising a change request, your team types the question and gets the answer — from the same governed data the dashboards use.
| Payer | Days | Outstanding |
|---|---|---|
| Insurer A | 84 | ₹ 42.6 L |
| TPA B | 71 | ₹ 28.1 L |
| Corporate C | 66 | ₹ 19.4 L |
| Scheme D | 63 | ₹ 8.7 L |
Illustrative. Figures shown are sample data.
Money, operations, clinical and control. Every tile clickable down to the transaction behind it.
Executive cockpit
Revenue analytics
Collections & cash
Revenue cycle
Payer / TPA
P&L and expense
Occupancy & beds
Length of stay
OPD & appointments
Turnaround time
Laboratory
Radiology
OT & surgery
Disease & case mix
Quality & NABH
Demographics
Referral sources
Doctor scorecard
Leakage & audit
Pharmacy
Inventory & stores
Purchase & vendor
HR & manpower
Multi-unit rollup
Plus a data readiness console that tells you honestly which dashboards your data can support today — and which need a field filled first. See every dashboard
These are the checks Prism runs against your own data before anyone builds a single dashboard.
Patients who left with no final bill raised against the admission.
A header total that disagrees with the sum of its own line items.
Bills modified post-entry, with the user, original figure and reason attached.
Services billed under the approved rate, grouped by who approved them.
The same doctor or TPA spelt four ways, quietly splitting every report about them.
Batches still carried at value that cannot be sold.
We do not publish a savings figure here, because it would be somebody else's. In the pilot you see your own count, and you decide what it is worth.
Dense, quick to read, and every figure a doorway into the detail behind it.
Type it, get a table or a chart, and pin it as a permanent tile. Every question, the query it produced and the tokens it consumed are logged and costed, and your administrators can see all of it.
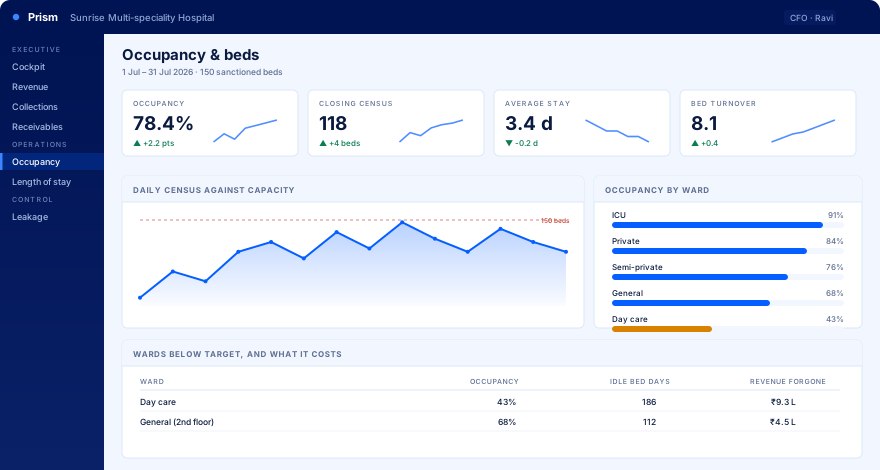
Against your real bed count, not an assumption. Wards running below target are listed with the idle bed days and the revenue that went with them, so the conversation starts from a number.
Bills modified after saving, rates below the master, back-dated postings, discharges never billed — with the user, the original figure and the reason attached. This is the screen that pays for the pilot.
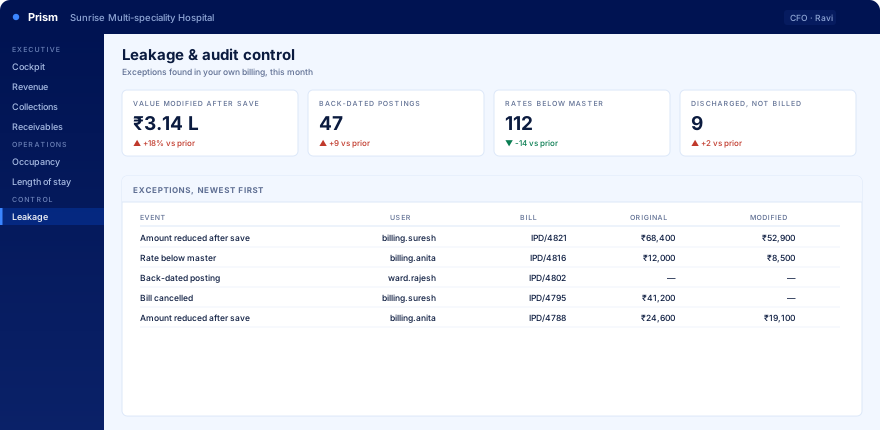
Screens shown with illustrative data. In a pilot these are built on your own figures.
No. Prism is a separate product and works with any hospital information system. Where a direct database link is possible we read from it; where it is not, your team uploads spreadsheets and Prism builds the same dashboards from those. Hospitals running Caresoft HIS get a faster start because the schema is already understood, but that is a head start, not a requirement.
Yes. The spreadsheet route exists for exactly this. You export the data you are willing to share, upload it, and Prism runs the same transformations it would have run over a live link. The numbers come out identical. Many hospitals begin this way and connect the database later once they trust the output.
No. Prism copies data into its own reporting database and every dashboard runs against that copy. The login it uses on your system has read rights only and cannot write to it. Your billing counters and wards are unaffected.
Patient identity is masked by default. Only users you specifically clear can see names and contact numbers, and every time they do it is recorded. Most management dashboards never need identity at all, since they work on aggregates.
Typically four weeks: connect and run the readiness checks in week one, financial dashboards in week two, operational dashboards in week three, and handover in week four. That assumes reasonably clean data, which the week-one readiness report tells you honestly rather than discovering in week three.
Someone in management types a question in plain English and gets back a table or a chart built from your own data. If the answer is useful they pin it and it becomes a permanent dashboard tile. It means new requirements do not need a change request, and it is why the product does not go stale six months after it is installed.
Yes, in detail. Every question is metered: which user asked it, which dashboard or report it belongs to, how many tokens it consumed and what that cost. The token log is visible to your administrators, not just to us, and each plan carries a monthly allowance you can watch against.
No. Prism reads the same source data your existing reports read, and where a report is worth keeping it can be registered and run on schedule, with its output landing in Prism alongside everything else. Existing reports keep working throughout.
That is normal, and Prism tells you rather than producing a confident wrong number. A readiness console checks fill rates on the fields each dashboard depends on and marks which modules your data can genuinely support today. Where a field is not being captured, that is a process fix, and it is better to know in week one.
One hospital, one month of your data, and the exception list from your own billing.